
Sales Reports are important for any business. Records of sales sold by a salesperson or a whole company within a particular time frame are called sales report. A great benefit can be gained from a sales report for business enterprises selling of goods or even services. This also helps in measuring, with the proper incorporation of key information, the success of the sales effort.
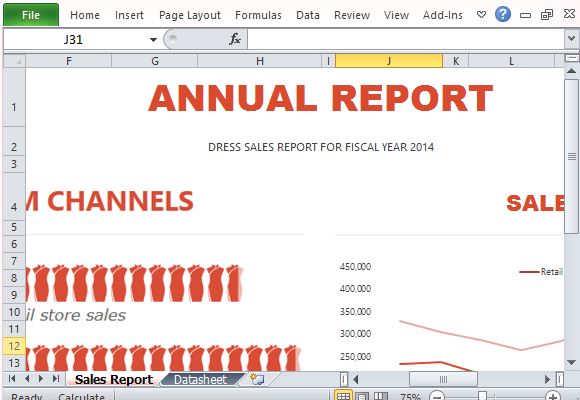
You can find many useful sales report templates on the Microsoft Office portal. The Sales Report Infographic Template is a beautiful and highly visual sales report template that features a customizable infographic. The Excel 2013 template vividly shows sales data in a way that lets you know facts even at first glance.
A closer look at this Excel 2013 Template will show you many beautiful features, such as two worksheet tabs, the Sales Report and the Datasheet tabs. The Sales Report worksheet tab contains visual data such as graph and chart to show a detailed documentation of the Sales from Channels and the Sales by Month.
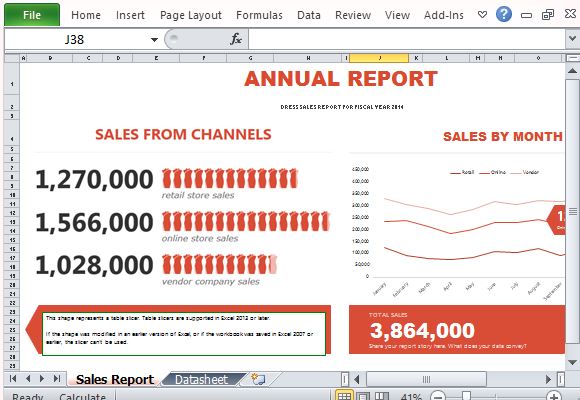
The Sales from Channel is a chart that shows how many units are sold in a store, such as clothes in a retail branch, online sales, or through vendors or distributors. The chart utilizes a People Graph app to signify the sales data in the form of people-shaped icons. This visualization shows you at first glance how sales are going in one channel as compared with others, instead of looking at rows and rows of numbers. You can use this visualization for Annual Sales Reports in PowerPoint slides.
On the other hand, the Sales by Month shows the sales in individual months of the whole year, in the three channels. The line graph shows you stark comparisons to help you depict the bigger picture and the trends to expect for the next year and beyond.
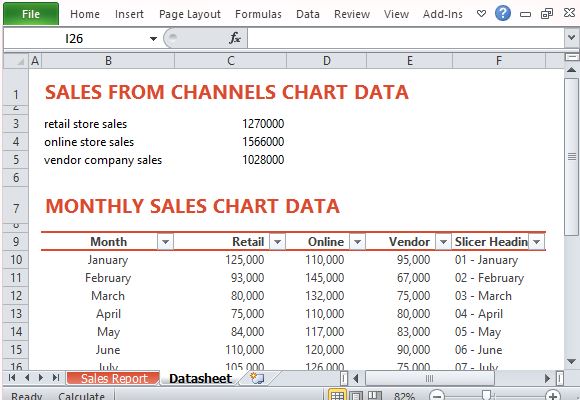
The other worksheet tab, the Datasheet tab, features the sales-by-month reports. The sales data are specified for each of the channel that generated it so you can easily identify which channel has made a good sales performance for a particular month.
Go to Download Sales Report Infographic Template for Excel 2013
Leave a Reply