
Having a sales forecast lets you anticipate how much effort your sales and marketing team needs to exert in order to reach performance and sales goals. Having a sales forecast done on a regular basis will also let you in on the trends so you can better direct your company to where it needs to go, especially if your company depends largely on its ability to sell its product or services.
Projecting your sales through a Sales Forecast Template for Excel such as the one we will discuss in this article is vital in allowing you to manage and project how much sales and profit you can expect for your business within a given timeframe. This Sales Forecast Template is a useful template that will help you with your planning and business goals.
The Excel 2013 Template, at first glance, would seem complicated and tedious, with its multiple columns and numerous rows. However, this information is key to giving you the necessary know-how you need for your report or presentation.
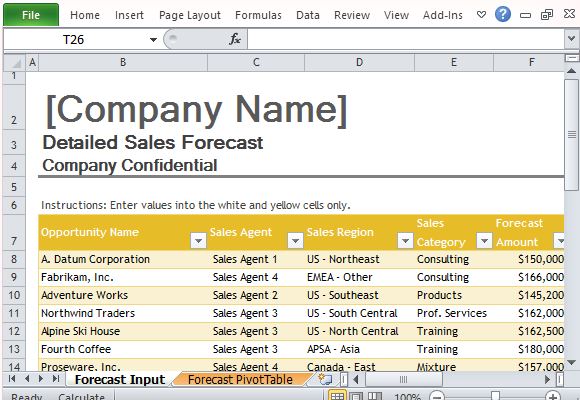
The template features an editable logo placeholder which allows you to easily insert your company logo and therefore customize it. It also features two worksheet tabs, the Forecast Input and the Forecast Pivot Table.
![]()
![]()
The Forecast Input is where you type in your data according to the required fields in the table. The table contains spaces for Opportunity Name, Sales Agent, Forecast Amount, Weighted Forecast, etc. Aside from forecasting your sales, the data will also allow you to track your agents and analyze their performance against each other.
The Forecast Input is a great tool for sales team leaders, managers, branch or regional managers, or anyone in the upper management. This worksheet tab allows you to be on tab of your sales, agents, clients, as well as help you determine how much your company can expect to earn within a given timeframe.
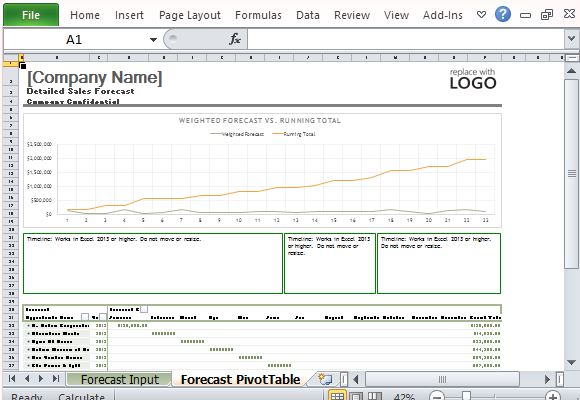
The second tab is the Forecast PivotTable. This contains the tables of the Forecasted Sales Closure and the Sales Amount per Opportunity Name. This tab gives you a road map of sales amounts through time. The PivotTable feature also makes it easy for you to view and display the information you want for analysis and reporting purposes.
You can download this and other free templates for Microsoft Office from the link given below.
Leave a Reply