
If you are involved in sales of product or services and have nationwide operations, there are plenty of ways for you, your team, manager, or company to keep track of sales performance. The performance of each sales agent in pushing the product or services to customers is important and this is where revenue comes in. It is important to regularly know how sales operations are going throughout your customer base to see what needs to be done for improvement, or if ever a change in marketing strategy or sales tactics needs to take place.
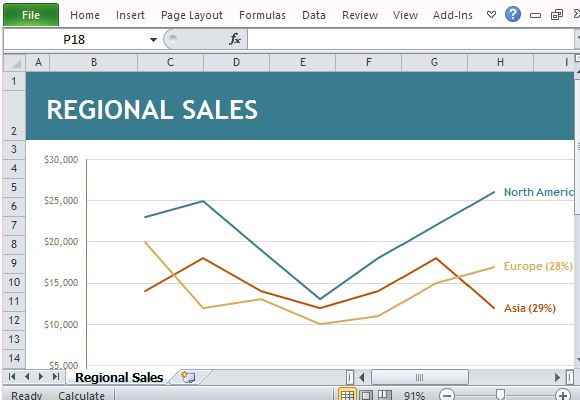
The Regional Sales Chart Maker Template for Excel is a free Excel 2013 template that you can use, whether you are an agent, a team leader, and especially if you are a regional manager. This sales template shows a graphic representation of sales performance by region. It also comes with a ready-made yet fully customizable table where you will type in your data to be translated into graph form. This chart template for Excel can be used to keep track of your sales, or display your regional sales performance for your report or PowerPoint presentation. You can have this furnished by your team or you can complete it on your own to be submitted to your bosses or business heads.
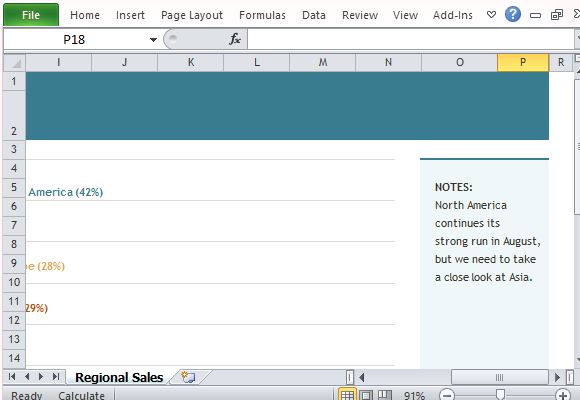
This template is helpful for those businesses whose main source of income is through sales, such as medical representatives, car sales, direct selling or household or beauty products, and many more. This shows which regions are performing well, which ones are mediocre, and which ones need a lot of improvement. This will help high-level business decision makers make analysis and actions based on the performances of each region. This can also help provide appropriate rewards or incentives, if necessary.
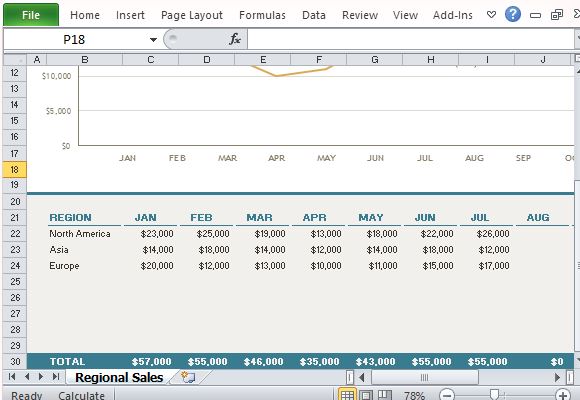
To use this template, simply type in your own sales data by region and month, and Excel automatically generates graphs for you.
Go to Download Regional Sales Chart Maker Template for Excel
Leave a Reply