
A breakeven analysis is done by every business entity to find out if their revenue equates the costs it takes to generate that revenue. This financial documentation allows businesses to determine their margin of safety, the amount that revenues need to reach that exceeds the breakeven point. This also helps business decision-makers to make forecasts and crucial decisions to ensure that the organization reaches its financial goals.
Comprehensive Breakeven Analysis
Creating a breakeven analysis is common practice to tell how much the minimum limit of revenue is, and to tell if they are on the right track with their costs and revenues. You can create a breakeven analysis from scratch, but you may have a hard time doing it for the first time. There are free Office templates for Excel that you can use to help you easily create a professional-looking breakeven analysis to present to your company or report to your bosses.
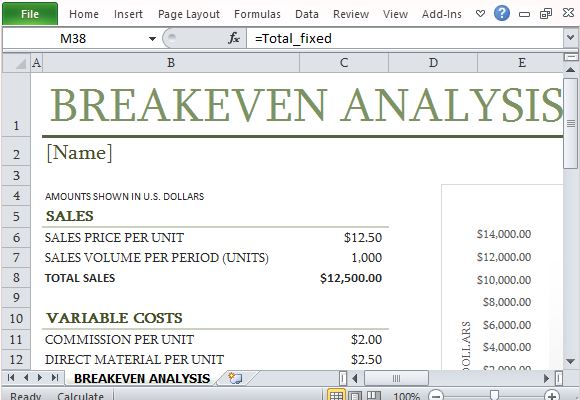
The Breakeven Analysis Template is an Excel 2013 template that features data-driven charts that allow you to present your data in highly visual format. This template is specially designed to clearly and accurately show and calculate costs, volume, and various other variables that affect a business’ profit generation. The template will show you and your business executives how much units you need to sell before you can say that your business is making a profit.
Generate Reports in Half The Time
Even with someone without an accounting background, or someone new to Excel, users can create a breakeven analysis using this template. And because it is one of the latest templates in Excel 2013, if contains multiple features that you cannot find in older versions, yet retains backward compatibility.
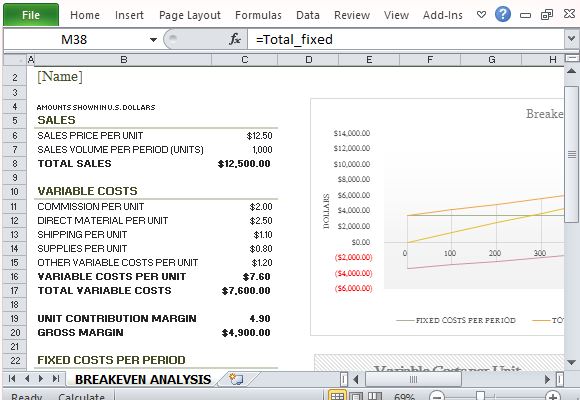
The template contains separate rows for entering data related to Sales, Variable and Fixed Costs, as well as Results. Under each of these categories are subcategories such as Administrative Costs, Property Tax, Rent, and Insurance. This allows you to easily see where your resources go as your company operates.
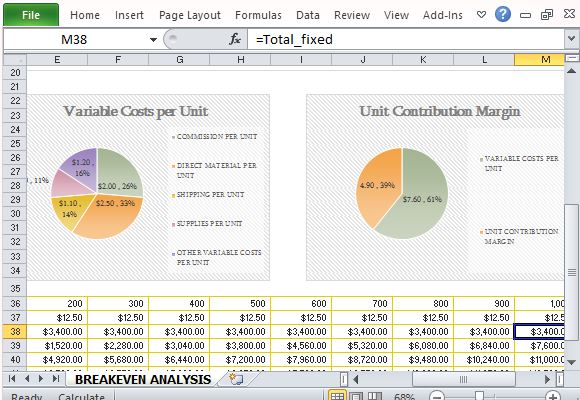
Another remarkable feature of this Breakeven Analysis Template for Excel 2013 is that it contains a specially dedicated set of cells for your company’s Sales Volume Analysis. This is a separate table built-in with its own set of formula to automatically calculate and refresh financial data as you type them in.
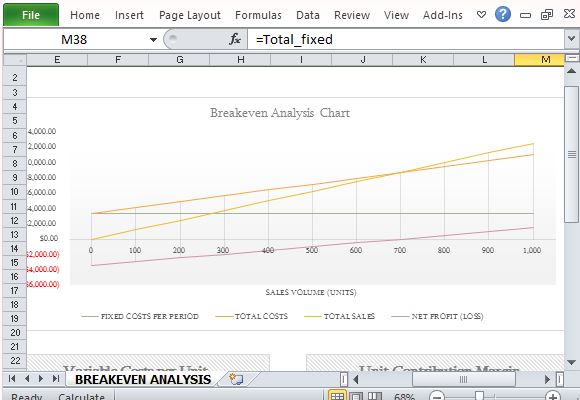
Data-Driven Charts for Reports and Presentations
Meanwhile, the Data-Driven Chart feature of the template allows you to display a visual data of your breakeven analysis. This way, you can easily embed the chart to Word format reports or PowerPoint presentations. Instead of starting a chart from scratch, this feature lets you save time in creating a professional looking chart.
This breakeven analysis template for Excel can also be reused multiple times for periodic reporting.
Leave a Reply