
Your business suffers from a dramatic drop in customer satisfaction. You are suddenly experiencing large amounts of spoilage in your stocks. Your expense reports are displaying dismaying figures. When you’re a business owner or a manager, you would want to find out why these things happen and find out a solution.
Create Cause and Effect Diagrams for Resolving Business Issues
In cases like the ones mentioned above, you would need to draft a cause and effect diagram to figure out what causes certain events that bring about significant impact to your business. You may also want to present these to your employees, colleagues, bosses, stakeholders, investors, and even customers. Whatever the case, there is a template that you can use.
The Cause and Effect Diagram Template for Microsoft PowerPoint is a free and very useful template to visually represent factors that cause certain events or problems. This template can help you draft a cause and effect diagram to better understand the forces that influence certain business outcomes. Set in a PowerPoint slide, you can use this template to show your message and findings to your audience.
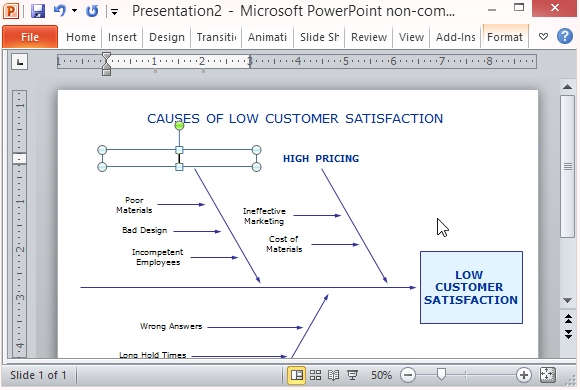
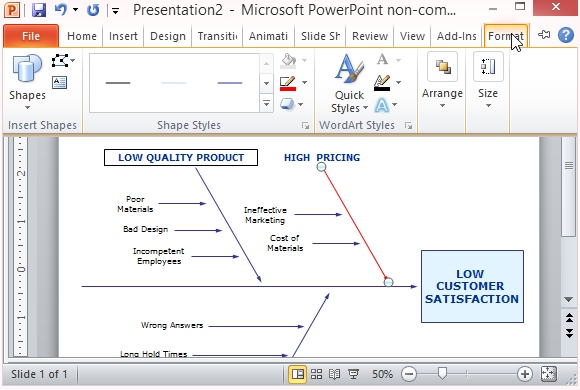
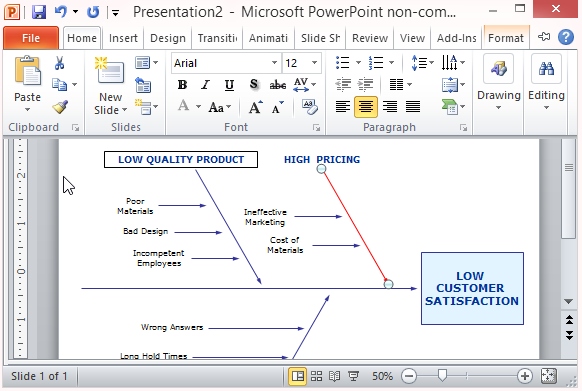
This cause and effect diagram template is set in a fishbone diagram. Like a fishbone, many lines point towards a main effect, which is the backbone that runs across the slide. The lines pointing towards that effect or backbone are categories of causes. With this diagram, you can easily list effects contributing to an issue and then group these effects together in the diagram. Thus, it can show you which category has the most impact and focus your activities in creating measures to do something about that cause.
The PowerPoint shows an example to make you better understand the structure of the cause and effect diagram. You can also follow this sample for your own business scenario. In the example, the effect, Low Customer Satisfaction, is in a square box where all big arrows are pointing to. The diagonal arrows pointing to the horizontal ones are aspects of the business that may have caused the issue: Low Quality Product, High Pricing, Poor Support. The smaller arrows indicate more case-specific causes for each category. This example is a wonderful guide for you to create your own cause and effect diagram.
This PowerPoint template is compatible with PowerPoint 2013 and also works with older versions.
Go to Download Cause and Effect Diagram Template for Microsoft PowerPoint
Leave a Reply