Business always comes with risks. Whatever industry you belong in, situations will inevitably come when you have to make either an educated decision or to take that leap of faith, as they say. The most successful businessmen and CEOs are those who are not afraid to take huge risks.
Still, this does not mean that you have to proverbially grasp at straws or make blind decisions. It is a wise, and practically advisable, move to analyse risks before taking them. This is why this template is an important part of risk management.

Risk Analysis PowerPoint Template
The Risk Analysis Template for PowerPoint is a highly useful template that you can use to identify and assess factors that may jeopardize the success of a project, proposal, or the company itself. This template can help you create better strategies to achieve organizational goals, as well as increase the success rate of your business endeavors.
Take Rewarding Risks
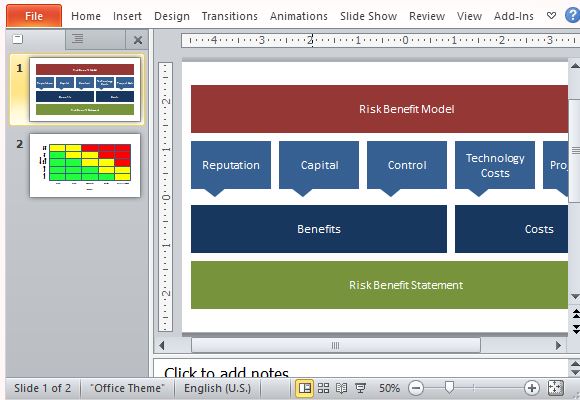
The Risk Analysis Template for PowerPoint tackles risks using tried and tested business principles and methodology. This template allows you to beautifully and visually display your Risk Benefit Model using shapes and charts. This template lets you categorize various potentials and scenarios that would help you pinpoint problem areas and risk advantages.

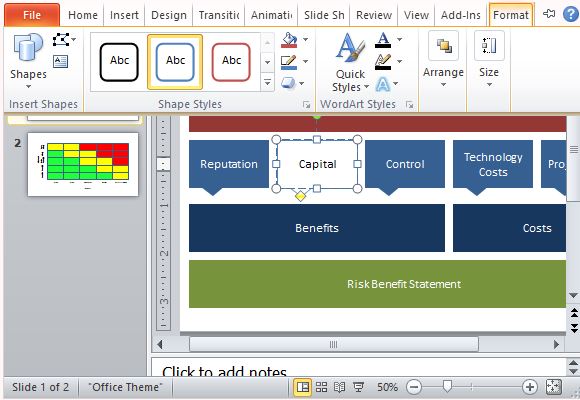
This PowerPoint Template cleanly organizes and lists down the benefits of taking that certain risk and sets it against the costs it entails. For the Benefits side, you can list what taking a certain risk can do to help your Reputation, Capital, and Control. For Costs, you can list down what that risk entails when it comes to Project Cost and Technology Cost. With this visual format, you can easily see if the benefits outweigh the costs.
Create Sound Business Decisions that Matter
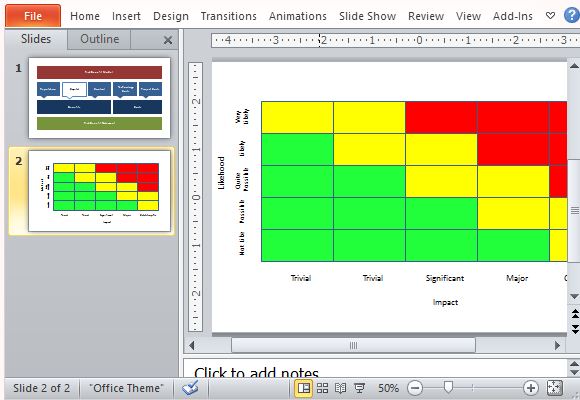
This Risk Analysis Template for PowerPoint can help you understand the situation by creating a visual map of the whole picture. This template also contains a second slide. This slide contains a grid that relates the risk in terms of Likelihood (Not Likely, Possible, Quite Possible, Likely, Very Likely) and Impact (Trivial, Significant, Major, Catastrophic).

This chart is created with a rectangular shape divided into grids. You can also create rows and then duplicate these rows to form a 5×5 grid. Then you can change the background colors of the grids to red, yellow and green.

Leave a Reply