A process flow shows the chronological order of how something gets done smoothly and efficiently. To discuss this with others in the workplace or in a school setting, you can use diagrams. The best way to convey processes such as this is through visual data that will simplify the steps so that it is easier for your audience to comprehend. You can create such visualizations by using free Office templates, such as the Process Path Infographic Template for PowerPoint.

This Process Flow Diagram Infographic Maker Template for PowerPoint can help you create highly visual process flow diagram infographics for use in training, education, as well as for business related purposes. Presenting huge amounts of information in chunks such as this will also help your audience better understand and remember what you are discussing.
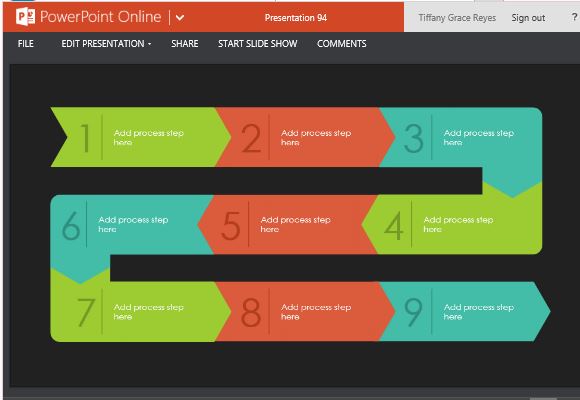
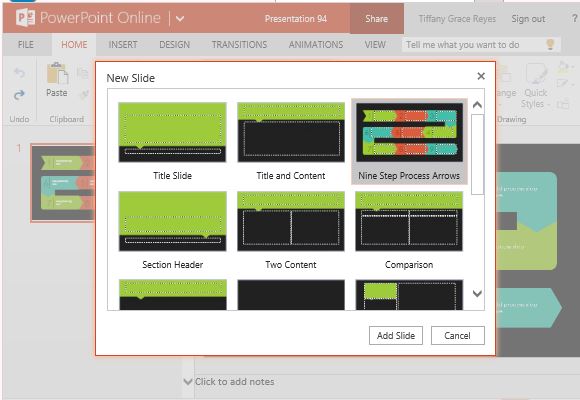
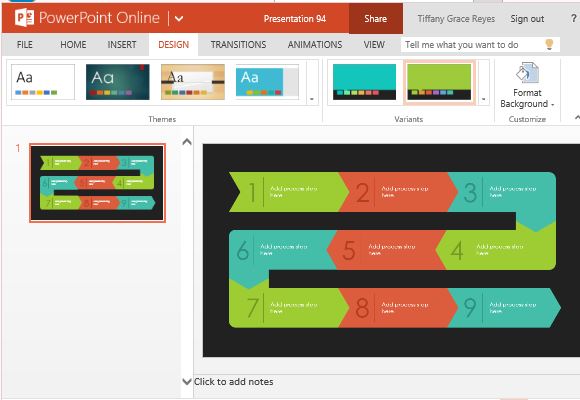
This PowerPoint Online Template for creating process flow infographic shows up to 9 steps that make up a continuous process. The chevron shapes have different colors against the dark background to represent phases, properties or difficulty levels. They are fitted together to show that there is no break in the system or method. Its curving effect makes full use of the single, widescreen format slide so you can fit up to nine steps without having to use another slide and break the continuity.

Minimalist yet highly functional in design, you can see that the sample labels are clearly set in each of the chevron shapes. The text is in big, bold white color to make it stand out against the different colors.
The sample text serves as a guide as you build your own process flow diagram infographic. You can click on the sample text and edit it with your own process labels or steps.

You can customize the colors to complement your own presentation theme, your personality, or your company’s branding. Nevertheless, the infographic template itself has a standard look that would suit most presentation designs.
Go to Process Flow Diagram Infographic Maker Template for PowerPoint

Leave a Reply