The sense of newly found freedom that you get when you go away for college comes with its own set of responsibilities. Having your own money and having the say on where to spend it can be an exhilarating feeling. However, keeping a budget may mean the difference between showing your restraint and foresight or going broke at this stage in life.
A budget can help you understand how your spendings affect your pocket. The College Budget Calculator Template for Excel is a very helpful tool for managing your finances through a budget.

This free template is available in Excel 2010 and later versions, though it also offers backward compatibility to earlier Excel releases.
The College Budget Calculator Template for Excel allows you to track your income and expenses so you can determine your spending habits. This lets you easily know if you are spending within your means as a college or university student. This will help you make sounder spending decisions and maybe even save you extra money for when you graduate.

The College Budget Calculator is a beautiful Excel template set in a black background, making it stylish while at the same time easily making the figures, tables and charts stand out. This template is pretty standard for graduate and even master’s students, and can be flexible enough to be used even for everyone who wants to create a budget.
This template is designed to efficiently help students with their college spendings, like tuition, books, projects, school fees, student loans, extracurricular activities, and living expenses.
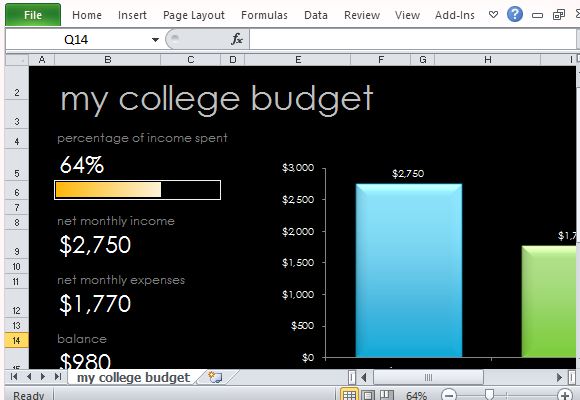
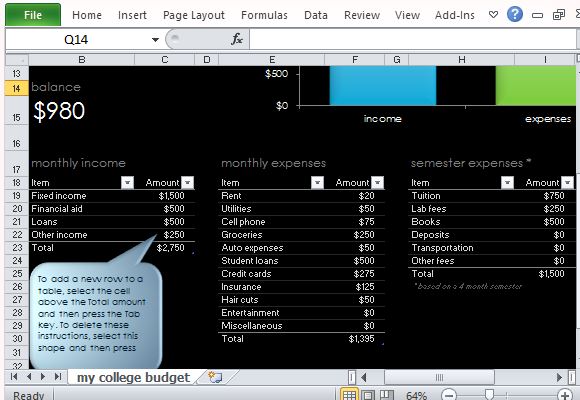
This template contains a single worksheet that contains a summary of your budget, a bar graph, and your monthly budget table. The monthly budget table is separated into your Monthly Income, Monthly Expenses, and Semester Expenses. The Semester Expenses are based on a four-month semester. The Monthly Income contains your Fixed Income, Loans, Financial Aid, and other sources of Income. These, along with your Monthly Expenses are computed, with the results shown on the summary and analysis above.

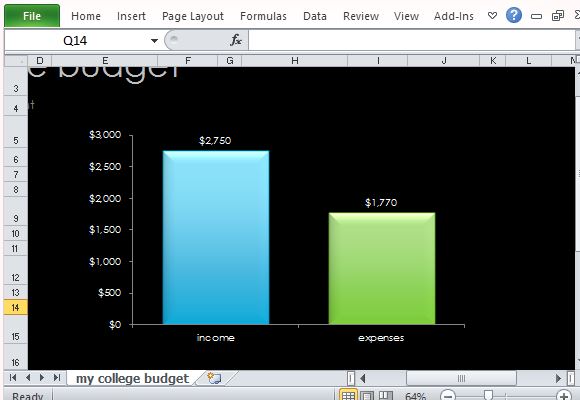
The Summary part of the template contains a visual representation of how much of your monthly income you have already spent. There is also a bar graph that compares your Income against your Expenses.

Leave a Reply