
If you are a sales manager, part of your job is in projecting and tracking the performance of your sales team. A sales manager can benefit from a worksheet template that helps in monitoring not only revenues but also the commissions of each of the members of the sales team.
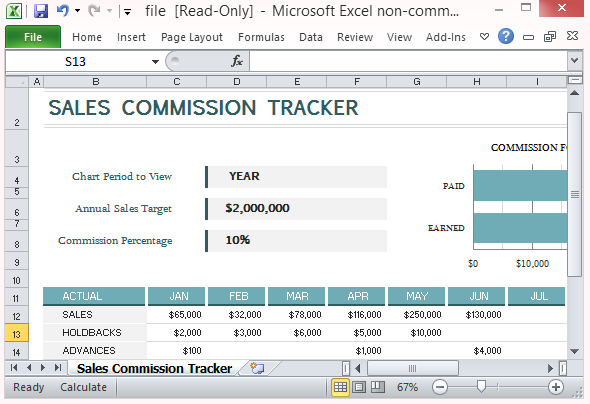
The Sales Commission Tracker is an Excel Template that can help you track the revenue generated by each of the members of your sales team and the commission that is due to each of them. This would help you identify those who are performing well and those who are lagging behind in their sales quota.
Note: You can download this and other free Office templates from the link given at the end of this review.
The sales and commission tracker template works best in Excel 2013, making full use of the sparklines chart feature. A Sparkline is a small, word-sized graphic, like a typography or font. With a sparkline, graphics are not looking cartoonish and instead can be used like a font, allowing it to be found anywhere a number or word can be. A sparkline can be embedded within a sentence, table, title, graph, map, to name a few. Sparklines lets you compress huge amounts of data into small, intense graphics, like in a chart in this sales and commission template for Excel 2013.
Here, you can type in your Projected Sales and Commission and then track the Actual Sales, Holdbacks and Advances through the months.
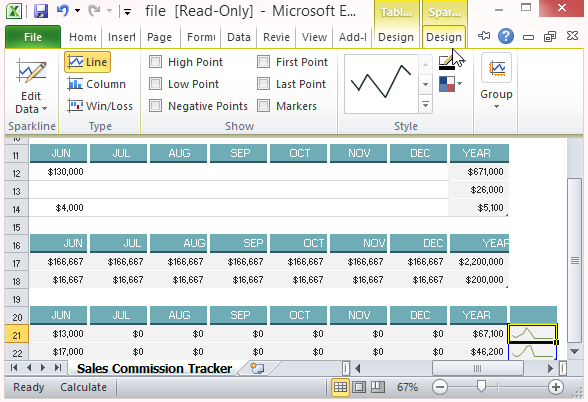
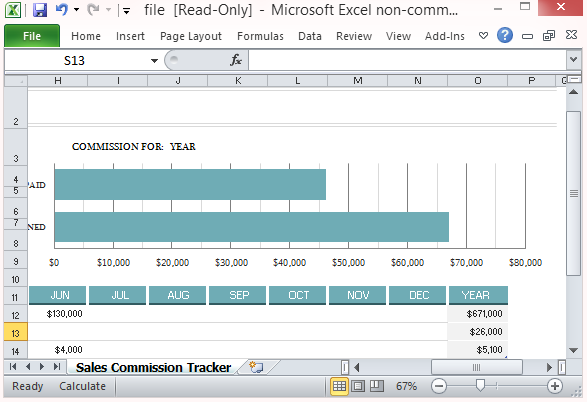
This Excel 2013 template also displays the earned and paid commission amounts through the months, with running totals automatically computed and shown on the far end of the rows.
Go to Download Sales and Commission Template for Microsoft Excel
Leave a Reply