
If you are really serious about making a change in your lifestyle and getting in shape, it pays off to stress the importance of keeping track of your activities and progress. Aside from creating a fitness plan, you should also log your workout activities, which can be done using relevant free Office templates.
The Free Running Log Template for Microsoft Excel provides a simple and convenient way for you to track your daily runs and watch your progress in tables and graphs. This Running Log template is set in Microsoft Excel and contains a separate table for typing in your log and a separate area for charts to track your progress.
Convenient and Easy to Use
It is important and more motivating that you can see how your hard work and exercise is paying off. With this Free Running Log Template, you can do just that without all the tedious work of creating a running log from scratch, which may take hours that you don’t really need. This easy template comes with all the format and formula that you need so all you have to do is type in all the necessary data in the indicated rows or cells.
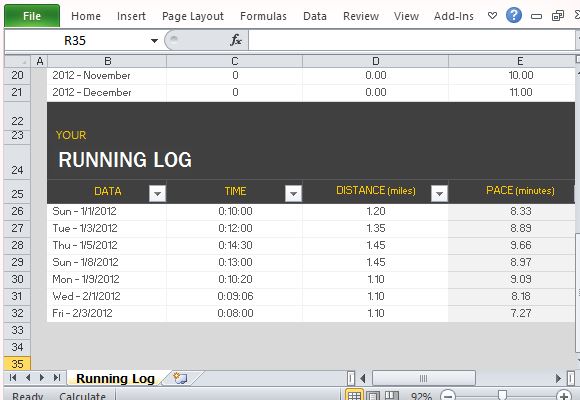
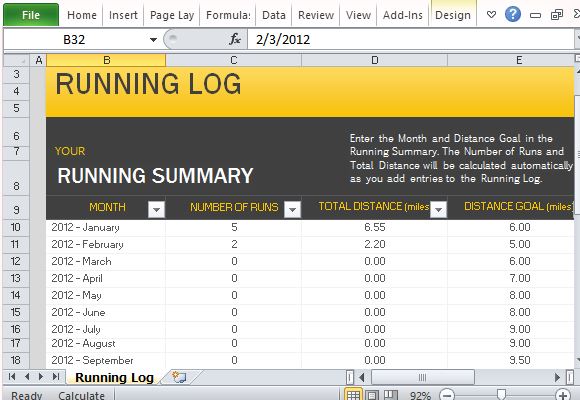
This log template contains separate tables for the Running Summary and the Running Log. The Running Summary shows the Number of Runs, Total Distance (in miles), and Distance Goal (in miles) for every month. Meanwhile, your Running Log shows your actual statistics for every running activity you have. It contains the Date, Time, Distance (in miles), and Pace (in minutes).
Visually Display Your Running Log
Another plus for this running log template is that it is free. There may be apps or software that you can get but may only be available if you pay a certain amount. This template is absolutely free and highly customizable. You can also easily see your progress in a beautiful and visual chart, as soon as you enter your data in the table.
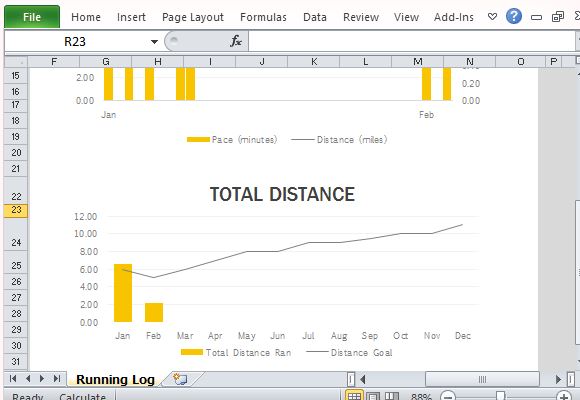
There is a Running Distance and Pace Chart, and there is a Total Distance Chart. The Running Distance and Pace Chart automatically calculates the pace and sets it against the distance of your run across the months. The pace is represented by a yellow bar while the distance is represented by a black line. The Total Distance Chart shows how much you have ran through the months. It also shows if you have reached your distance goal, which should normally increase as you progress through the months. The distance is represented by yellow bars, while the distance goal is represented by black lines.
Go to Download Free Running Log Template for Microsoft Excel
Leave a Reply